module 1
WIKI 1
An important water body in the area surrounding our school is a pond named as 'BHABA POND'. Upon surveying through the local people, our team gathered the following information :
b. For washing clothes & utensils
c. For idol immersion
d. A major puja(A religious festival) - CHATTH PUJA
e. For pisciculture & fishing -
i. fishing over here is done very scientifically, so that the small fishes can sustain and grow & then they are fished.
ii. A membership card is required to fish in the pond. The cost of membership is Rs.1000 for a
year. People who have the card, say that, the membership amount is affordable and is not too high.
iii. As per local habitants, the no. of applicants has increased over the years.
iv. The types of fishes cultured are ROHU, MAJOR CARP, TELAPIA, CICHLID etc.
- The area of the lake is under the authority of Durgapur Municipal Corporation (DMC). The initial work of construction of the pond was done under the joint efforts of DMC & BHEJ ( BHEJ is a local club authority which maintains the lake, throughout the year.). The exact year of establishment of the lake is still unknown, but local people say, it was established in and around 1940s.
- The lake is used for a variety of purposes -
b. For washing clothes & utensils
c. For idol immersion
d. A major puja(A religious festival) - CHATTH PUJA
e. For pisciculture & fishing -
i. fishing over here is done very scientifically, so that the small fishes can sustain and grow & then they are fished.
ii. A membership card is required to fish in the pond. The cost of membership is Rs.1000 for a
year. People who have the card, say that, the membership amount is affordable and is not too high.
iii. As per local habitants, the no. of applicants has increased over the years.
iv. The types of fishes cultured are ROHU, MAJOR CARP, TELAPIA, CICHLID etc.
- The lake is well maintained. Every two-three months, the water is cleansed using dis-infectants.
- DMC takes a major effort in cleaning the pond after idol immersion by employing local people to take out debris from the pond.
- The lake has no such hygienic complaints. As per the local people who use the water never had any severe diseases due to the water except some who has allergic problems from such conditions.
- The lake has a remarkable water level hold, i.e., the water level does not go down than one foot from the shore in any season moreover it raises unto brim during the rainy season. The local people claimed that they have never seen the lake to dry up ever.
- The depth is around,
i. Ten feet in the center.
ii. Fifteen feet at the, side due to further efforts of making it deeper. - The lake has in total five Ghats.
- The shore cleaning is also a regular effort by DMC.
- The lake is also made a regular visit by the sub-inspector.
- The has no such drinking usage since the municipality has fixed a water source for the locality.
WIKI 2
1.Subhadip Nandy: 709.2 gallons/day 2.Soumit Das: 1101 gallons/day
3.Aniket Nandi: 989.3 gallons/day 4.Simon Sarkar: 1140.6 gallons/day
5.Sayan Mondal:1207 gallons/day
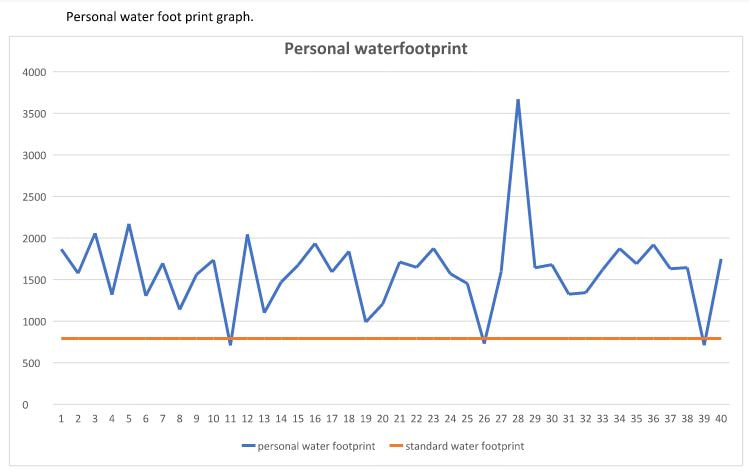
- The above graph depicts the water footprint of 35 people of eastern India. The Indian standard water footprint is 792.5 gallons/day and that of united states is 2060 gallons/day as an estimate from the above 35 people, the average water footprint accounts to 1804.37 gallons/day which is quite high than the standard water footprint of India. It depicts the high usage of water in India which remains uncounted in the whole country’s average usage.
- The highest value of the water footprint is found to be 3669 gallons/day. If the ratio of such high-
level water users accounts to 1:35 then in the huge population of 120 crore the number of such users shall increase by a huge margin, causing excessive usage of water in various ways.Since the water footprint consists of various categories, there are many areas where and when if appreciated, shall lead to high water usage. Moreover, it might be that, some of these areas are not much required, thus those areas should be triggered to minimize the high-water consumption.Many a times it leads to the question of availability of advanced technology. Many of the houses dohave access to the various modern machineries which helps in minimizing the water usage for household purposes.
1.Subhadip Nandy: 709.2 gallons/day 2.Soumit Das: 1101 gallons/day
3.Aniket Nandi: 989.3 gallons/day 4.Simon Sarkar: 1140.6 gallons/day
5.Sayan Mondal:1207 gallons/day
ACTIVITY 1 (rainfall)
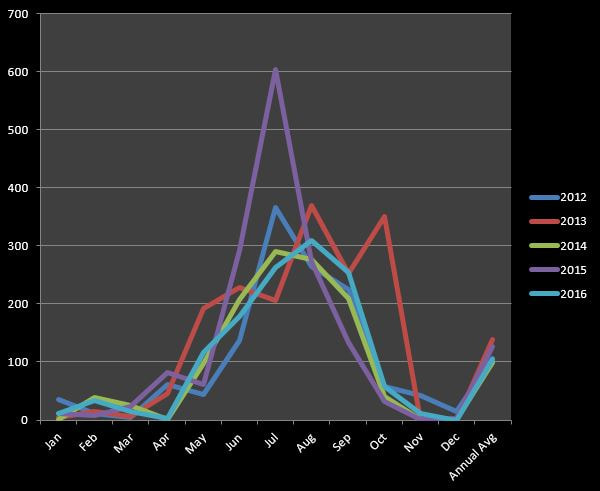
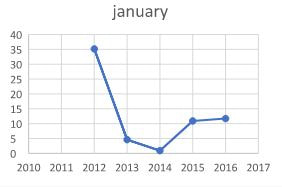
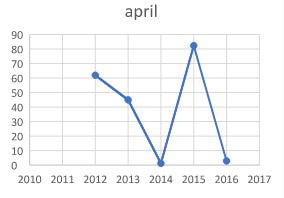
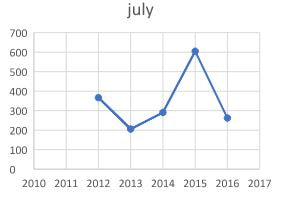
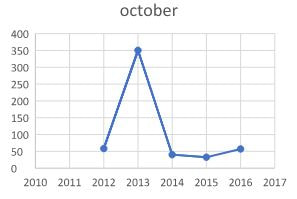
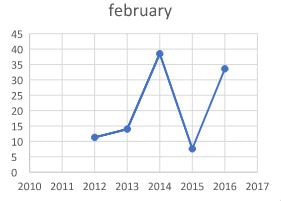
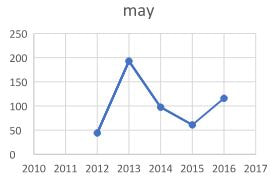
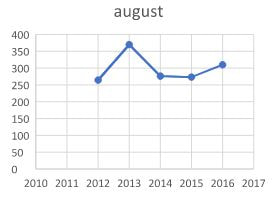
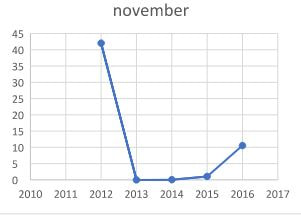
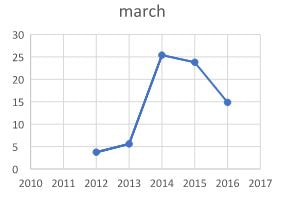
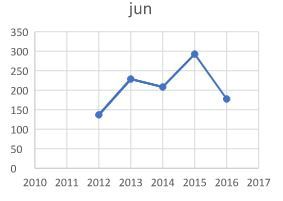
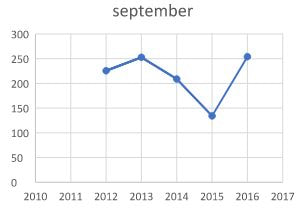
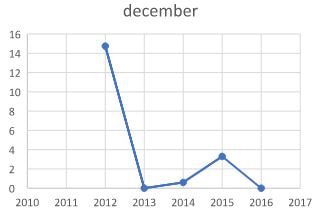
The data represents the rainfall analysis of Bardhaman district of West Bengal from the year of 2012 to 2016. The data depicts the variation of rainfall throughout the year. It is clearly visible that the rainfall during the months of monsoon season is higher than the other months.
From the data it is clear that the year 2015 had highest rainfall level than other years with annual rainfall average 127.265 centimetres and the year with lowest rainfall level is 2014 with the annual rainfall average 99.00833
centimetres.
From the data it is also clear that the rain fall level is quite high in the month of July with the rainfall average, from the year 2012 to 2016, 346.03 centimetres and the lowest rainfall level in the month of December with rainfall level 3.73 centimetres.
The rainfall level trends to be increasing from the month of April and then running towards the highest level in the months of July and August then decreasing and merging towards lowest rainfall level in the months of December. The rainfall seems to be maintaining the average in the previous year with beneficiary results in the previous year.
The rainfall data has been obtained from:
1.http://hydro.imd.gov.in/hydrometweb/(S(tbzhjty5bv55wwejve31yrba))/DistrictRaifall.aspx
Monthly analysis of RAINFALL ( 2012 - 2016 )
|
|
|
ACTIVITY 1 (groundwater)
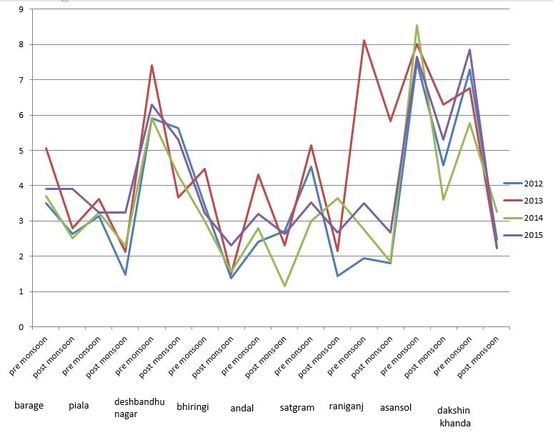
This data represents the ground water level of the burdwan district of west Bengal from the year 2012 to 2015. The graph depicts the variation of water level in the referred areas in pre and post monsoon condition.
The source of information of the groundwater level has a detailed information about the pre and post monsoon water level from the year of 2012 to 2015 and previous to that the information mainly consists of the post monsoon ground water level.
The graph clearly visualizes that the wells under Asansol has lower ground water level than all other regions of survey.In Durgapur barrage and piala region the ground water level average of the post and pre monsoon water level variation is quite standard since it is nearby to the damodar river.
In Durgapur barrage the maximum variation of the ground water level is seen in the tear of 2013 that is 5.05 during pre monsoon and 2.08 during post monsoon period and the minimum variation of water level is seen in the year 2015 which is 3.91 during the post and pre monsoon period.
In piala region, the variation of water level is observed to be minimal with maximum variation in the year 2012 which 3.14 during pre monsoon period and 1.48 during post monsoon period. The minimum variation is seen in the year of 2015 which is 3.24 in both pre and post monsoon.
In desbandhunagar, the average ground water level by combining the pre and post monsoon period is not seen to be in the safe zone. With minimum ground water level in the year of 2015 which 6.3 in the pre monsoon and 5.3 in the post monsoon period.
The ground water level is affected by the amount of precipitation in a year. Similarly, the ground water level of eastern India has also been affected with the relative rainfall of respective years. Moreover, from the graphs of rainfall and groundwater level, the year 2015 has been marked with high ground water level which can be related with the highest rainfall level in the year 2015. Also, the lowest ground water level in the year 2012 can be related with the low rainfall level in the year 2012. This type of data plots clearly visualizes the relation of groundwater level with precipitation.
